The Profiler
Where your frame time and memory actually go. The profiler is part of the engine — nothing to install, and it works on a phone as well as on your desktop.
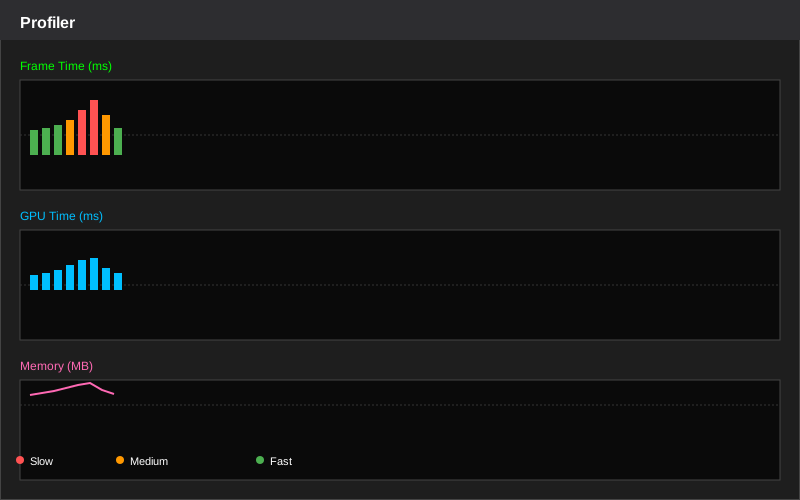
Guessing at optimisation is how you spend a week making the wrong thing faster. Open this first.
Getting started
Open the Profiler panel — Windows → Panels → Logging → Profiler. It records continuously; the toolbar button toggles between Recording and Paused — pause it the moment you see the hitch you're chasing, so it doesn't scroll away.
The rest of the toolbar is about keeping results:
| Button | What it does |
|---|---|
| Save | Writes the current capture to a .jcap file |
| Load | Opens a capture you saved earlier |
| Compare | Opens a capture alongside the current one, so you can see whether a change helped |
Compare is the one people underuse. Capture before your change, capture after, compare — that's the difference between knowing and believing.
The views
Pick a view from the dropdown (or the View menu). You won't need all ten; here's what each is for.
Timeline
The default. Frame time over time, with the frame's work broken down. Spikes here are the hitches a player feels. Click one to select that frame and look at it in the other views.
This is also where CPU versus GPU gets settled. If GPU time is the number pinning your frame rate, no amount of script optimisation will help — you need fewer draw calls, fewer or cheaper pixels. If CPU time dominates, the opposite.
Flame Graph
For a selected frame: every function that ran, stacked by who called whom, with width proportional to time. The widest bar at the bottom that you recognise is usually your answer. Click to zoom into a subtree.
Call Tree
The same data as a tree you can expand, and it can be inverted — "which functions cost the most in total", rather than "what did this frame do in order". Inverted call tree is the fastest way to find a cheap function being called far too often.
Statistics
Per-zone totals, averages, and p95/p99 times. Averages hide hitches by design; the 99th percentile is where a stutter that happens once a second lives.
Memory
Usage broken down by category — textures, audio, meshes, scenes, scripts, shaders, UI — with current and peak figures, plus entity pool occupancy. Peak is the number that matters on a phone: it's what the OS reacts to.
Assets
An engine-event track: scene loads, asset packs, texture uploads, file I/O, on the same time axis as everything else. This is the view that answers "why did the frame after the door opened take 40 ms" — because an external profiler doesn't know what an asset is, but this one does.
Histogram
The distribution of frame times. A tall narrow spike at your target frame time is a healthy game; a long tail to the right is a game that mostly runs well and occasionally doesn't.
Sampling
The instrumented views only show code someone marked. The sampler periodically records what's actually running, so it finds hot code nobody thought to instrument — including inside libraries and your own scripts.
Comparison
Two captures side by side. This is what Load and Compare feed.
Analysis
Automatic findings — the profiler pointing at things that look wrong before you've gone looking.
Marking your own code
Wrap anything you want to see by name:
protected override void OnUpdate(float ts)
{
    using (Profiler.Zone("EnemyAI"))
    {
        UpdateAI(ts);
    }
}
EnemyAI now appears in the flame graph, the call tree and the statistics view. Zones compile out of a Release build, so you can leave them in shipping code at no cost.
Watching allocations
Garbage collection is the classic mobile hitch. The counters are readable from script:
if (Profiler.AllocatedBytesThisFrame > 0)
    Log.Warn($"allocating {Profiler.AllocatedBytesThisFrame} bytes/frame");

Profiler.AllocationBudgetBytesPerFrame = 4096;   // warn, naming the worst offender
Profiler.GCCount tells you how many collections have happened; how fast it climbs during gameplay is what matters, not the number itself. See Performance for the five habits that get steady-state gameplay to zero bytes per frame.
On the actual device
Desktop numbers do not predict phone numbers. Export a Development build to the device and use the on-screen overlay to watch frame time and memory on the hardware your players have.
Development builds only
Zones, allocation counters and the budget warning are all compiled out of a Release build — which is why you profile a Development build. The Memory counters are the exception: those work everywhere.
A workflow that works
- Play until you see the problem, then pause.
- Timeline — click the spike. Is it CPU or GPU?
- Flame Graph on that frame, or Call Tree inverted if the cost is spread out rather than in one place.
- Save the capture before you change anything.
- Make one change.
- Compare against the saved capture.
One change at a time. Two changes and a faster frame tells you nothing about which one did it.
See also
- Performance — texture compression, pooling, and allocation discipline
- Scenes — what a scene costs, and watching it come back on unload